Institutional Effectiveness
Outcomes & Assessments for LBC
Lancaster Bible College’s Office of Institutional Effectiveness presents the following information as measurable evidences of the college’s outcomes and assessment.
Information Posted October 16, 2025
Our Mission
LBC exists to educate Christian students to think and live a biblical worldview and to proclaim Christ by serving him in the Church and society.
Our Vision
LBC will strengthen the foundation that will enable us to be the leader in collaborative, contextualized biblical higher education in the U.S. and around the world.
Our Values
Lancaster Bible College has established a set of values to serve as the compass for fulfilling its mission. The LBC experience is an important factor in the development of ministry leaders. LBC’s values are as follows:
Biblical. We apply God’s Word to all of life.
Stewardship. We maximize and multiply God’s resources.
Collaboration. We work with others to accomplish our mission.
Innovation. We strive to continually improve to give God our best.
Servanthood. We serve others to bring out their best.
Institutional Evidences
The following are the primary means used to measure institutional attainment of objectives and to document student success.
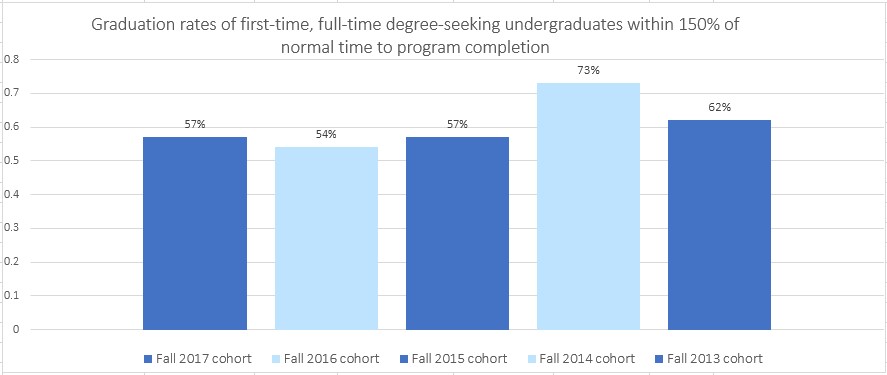
| Cohort Total | Graduates | |
| 2018 Fall Cohort | 189 | 126 |
| 2017 Fall Cohort | 154 | 110 |
| 2016 Fall Cohort | 164 | 112 |
| 2015 Fall Cohort | 185 | 114 |
| 2014 Fall Cohort | 211 | 153 |
| 2013 Fall Cohort | 134 | 83 |
Most recent data available as of October 1, 2025
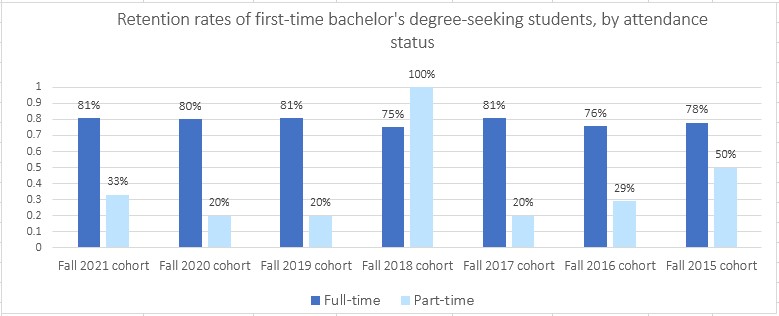
| Student Retention | FT Cohort total | FT Returning students | PT Cohort total | PT Returning students |
| Fall 2024 | 199 | 142 | 125 | 44 |
| Fall 2023 | 181 | 134 | 65 | 20 |
| Fall 2022 | 167 | 125 | 12 | 5 |
| Fall 2021 | 140 | 113 | 6 | 2 |
| Fall 2020 | 154 | 123 | 5 | 1 |
| Fall 2019 | 163 | 132 | 5 | 1 |
| Fall 2018 | 171 | 128 | 2 | 2 |
Most recent data available as of October 1, 2025
| Department | Graduation Year | # of graduates | Employed in field and/or pursuing further education within one year of graduation+ |
| Arts & Sciences | 2023-2024 | 12 | 43% |
| 2022-2023 | 15 | 40% | |
| 2021-2022 | 16 | 50% | |
| 2020-2021 | 5 | 80% | |
| Bible & Ministry | 2023-2024 | 265 | 47%** |
| 2022-2023 | 136 | 42%** | |
| 2021-2022 | 188 | 49%** | |
| 2020-2021 | 196 | * | |
| Business Administration | 2023-2024 | 72 | 60% |
| 2022-2023 | 59 | 83% | |
| 2021-2022 | 87 | 71% | |
| 2020-2021 | 46 | 100% | |
| Communication & Media Arts | 2023-2024 | 16 | 83% |
| 2022-2023 | 19 | * | |
| 2021-2022 | 26 | 80% | |
| 2020-2021 | 24 | 71% | |
| Counseling & Social Work | 2023-2024 | 61 | 89% |
| 2022-2023 | 46 | 74% | |
| 2021-2022 | 59 | 55% | |
| 2020-2021 | 22 | 100% | |
| Education | 2023-2024 | 35 | 83% |
| 2022-2023 | 29 | 90% | |
| 2021-2022 | 39 | 83% | |
| 2020-2021 | 24 | 83% | |
| Music, Worship & Performing Arts | 2023-2024 | 14 | 75% |
| 2022-2023 | 11 | 71% | |
| 2021-2022 | 11 | 40% | |
| 2020-2021 | 17 | 71% |
* Employment data not collected for these years
** Includes graduates who earned degrees for personal enrichment rather than for a career
+ Based on Spring 2025 survey responses
Most recent data collection: Spring 2025
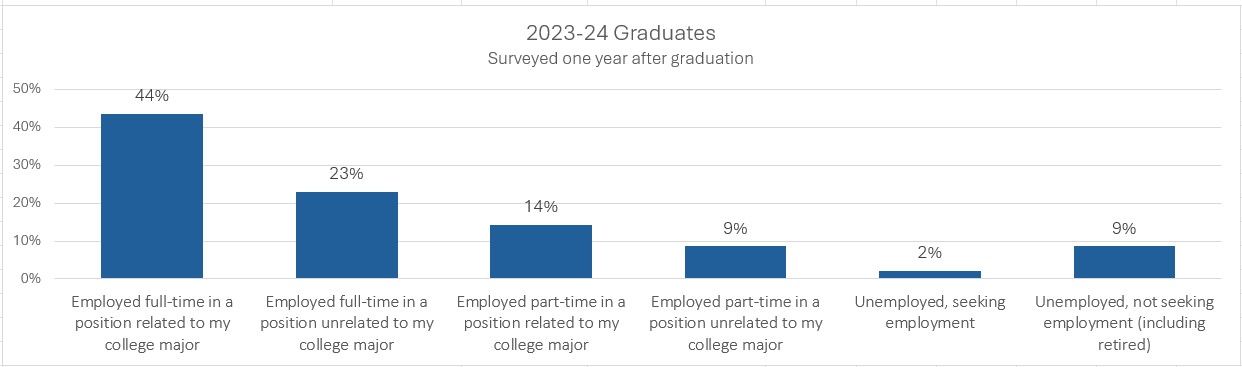
| Employed full-time in a position related to my college major | 61 |
| Employed full-time in a position unrelated to my college major | 32 |
| Employed part-time in a position related to my college major | 20 |
| Employed part-time in a position unrelated to my college major | 12 |
| Unemployed and seeking employment | 3 |
| Unemployed, not seeking employment (including retired) | 12 |
| Total survey responses | 140 |
Source: Spring 2025 survey of 2023-2024 graduates.
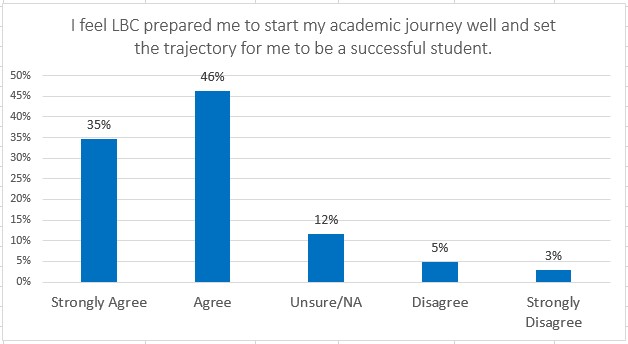
Source: 2025 Survey of 280 Graduating Students
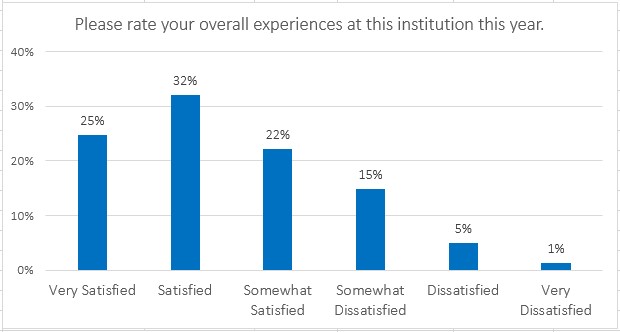
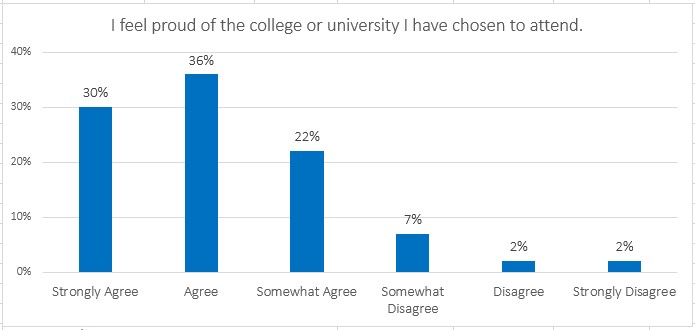
Source: 2025 Student Experience Survey of 403 on-campus students
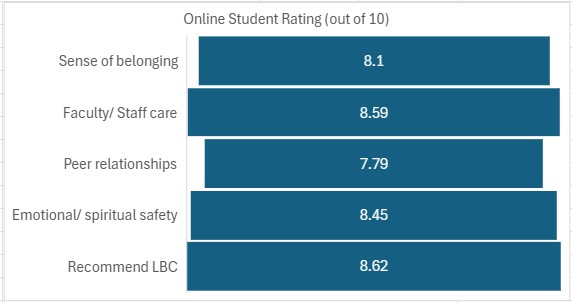
Source: 2025 Student Experience Survey of 673 online students
| 2024 Responses Excellent or Good |
| First-year students 92 of 101 |
| Seniors 90 of 104 |
Source: 2024 NSSE
| 2024 Responses Definitely or Probably |
| First-year students 88 of 101 |
| Seniors 88 of 104 |
The links below lead to program outcomes and assessments. On the program page, use the left navigation pane to select Assessment Findings under the most recent assessment cycle.
- Arts & Sciences
- Biblical Studies
- Business Administration
- Christian Thought in the Humanities
- Criminal Justice
- Digital Communication
- Education
- International Studies
- Media Arts Production
- Musical Theatre
- Next Generation Ministry: Children & Family | Youth & Family
- Pastoral Ministry
- Performance
- Psychology
- Social Work
- Sport Management
- Worship Arts
- Doctor of Ministry
- Doctor of Philosophy in Leadership
- Master of Arts in Biblical Studies
- Master of Arts in Clinical Mental Health Counseling
- Master of Arts in Contextualized Pastoral Ministry
- Master of Arts in Formational Leadership
- Master of Arts in Ministry
- Master of Arts in Strategic Communication Leadership
- Master of Divinity
- Ministry Leadership